Is it time to celebrate India’s ‘improved’ sex ratio? Reasons to question NFHS data
By Aditi Chaudhary*
The recently published National Family Health Survey (NFHS) factsheet brought cheers amongst the public and the government. With Child Sex ratio (number of females per 1000 males in the age group 0 – 6 years) and overall sex ratio (the total number of females per 1000 males), both showing an improvement, NFHS-5 (2019-21) got applauded by all around.
The World Health Organization (WHO) recommends the sex ratio to be 952 females per thousand males. An ideal scenario of sex ratio tends to be 1:1 owing to various factors such as natural selection at birth and others. The child sex ratio increased from 919 in NFHS-4 (2015-16) to 929 females per 1000 males in NFHS-5 (2019-21). Further, there is also an improvement in the Sex ratio of the total population from 991 females to 1020 females per 1000 males.
It is unprecedented and commendable for India to overcome all the biases and discrimination that women face and acquire a healthy sex ratio. The numerical excess of women over men while facing social evils like female foeticide, female infanticide and dowry deaths is welcome. This increase is the paradigm shift that the government and stakeholders have strived for.
However, the sex ratio mentioned by NFHS-5 cannot be truly considered to show the actual change. The 2011 Census had reported the sex ratio to be 940 females per 1000 males, and NFHS-5 shows 1020 females per 1,000 males.
Some reasons to question the phenomenal increase in sex ratio in the last decade are as follows:
First of all, one should understand the national-level survey’s definition to calculate the sex ratio. It uses modified de facto enumeration It enumerates people based on “where they spent the last night prior to the day of enumeration”
Here, we cannot deny the possibility of rural men and women being away from their homes on the last night of the enumeration. Men not present at the time of the survey, presumably for work or other reasons, could have also led to inflation of the sex ratio.
Then, NFHS is a well-designed, comprehensive survey that calculates sample size using probability proportion to size. However, inevitable systematic errors and disturbances during data collection due to the pandemic could have also fuelled the ratio. More females also appeared because the survey was conducted around the COVID-19 period and in two phases (pre-pandemic and second wave).
Also, one cannot rule out more males getting infected and succumbing to COVID-19. Men tend to migrate and go out more than women for work, and hence, the chances of getting infected increase. A considerable number of men also lost their lives while returning to their native place during the first phase of the pandemic.
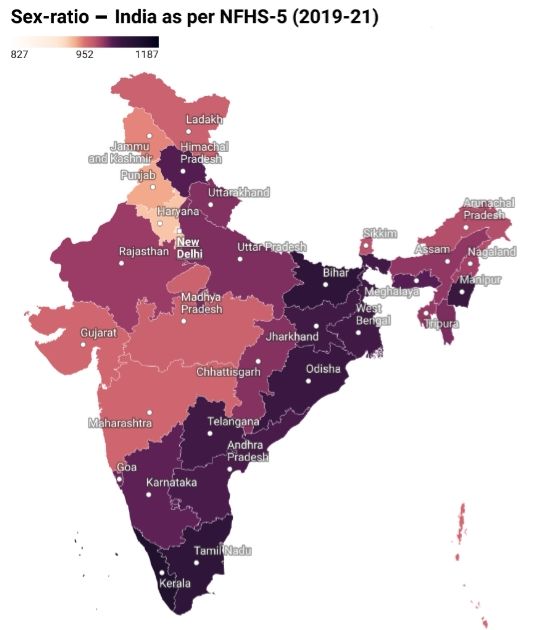
Lastly, NFHS-5 shows that the child sex ratio is still low in Goa 838, Himachal Pradesh 875 and and Telangana 894. Alternatively, some states and UTs have also shown a decline in overall sex ratio from NFHS-4 to 5 viz Andaman and Nicobar, Himachal Pradesh, Jammu and Kashmir, Ladakh, Chhattisgarh and Chandigarh.
The map shows States with lower overall sex ratios are Arunachal Pradesh, Gujarat, Haryana, Jammu & Kashmir, Maharashtra, Madhya Pradesh, and Punjab.
This univocal pattern compels us to conclude that while there has been a specific increase, the magnitude nevertheless is highly questionable.
Hence, considering the various possibilities, there is still time and a lot to be done before settling and celebrating the increase in numbers. The accurate picture can only be shown by the upcoming Census of 2022 because undoubtedly, it is the biggest, most dependable, and complete population enumeration for any country.
—
*Senior Doctoral Fellow, International Institute for Population Sciences, Mumbai
courtesy counterview
Leave a Reply